Countries that have vaccinated more people do not seem to have benefited from an improved covid-19 mortality trend. Rather, in most places, more vaccinations have correlated with a relatively worse covid-19 mortality trend.
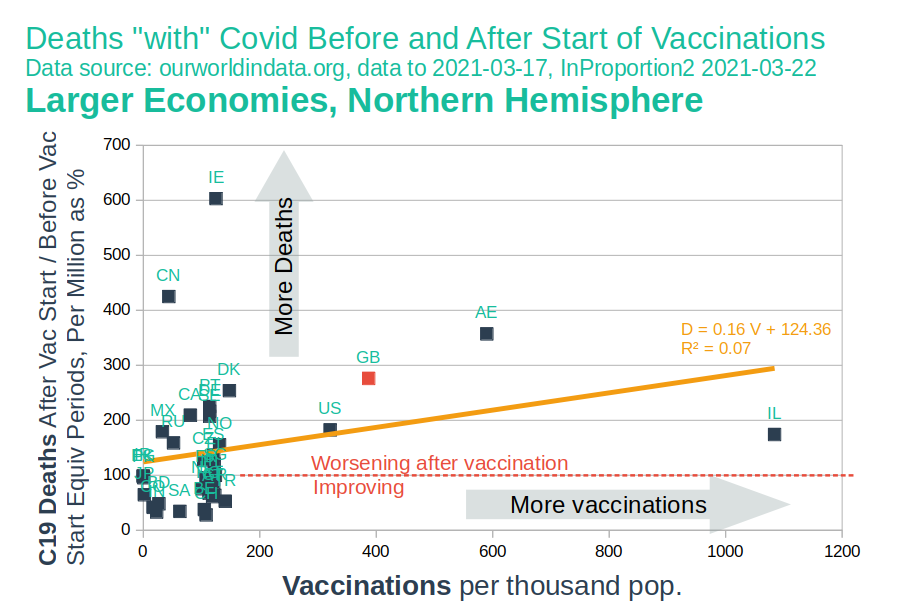
The UK has only vaccinated less than Israel and United Arab Emirates, but has a worse mortality trend than all but Ireland, China and United Arab Emirates
First, a Note on Scepticism
Vaccines are a controversial topic. Often it seems almost taboo to question whether a particular vaccine provides an adequate balance of safety and efficacy. It should be remembered that scepticism is at the heart of science and that hostility towards scepticism is "anti-science". Furthermore, celebrity endorsements of vaccines inform far less than scrutiny of evidence and data.
Conclusions
In the northern hemisphere, countries that have administered more vaccines per head of population tended to have worse covid-19 trends than other countries when comparing the number of deaths happening in equivalent periods before and after the date of the first vaccination in that country.
Correlation famously is not causation. There will be a variety of reasons why mortality levels and trends are the way they are. For example, as winter recedes, it is natural to expect respiratory diseases to recede with it. However, it is hard to claim that vaccines are some kind of panacea when mortality trends are either unaffected or affected relatively negatively in countries that have administered more vaccines than others.
In general, the roll-out of vaccines in the northern hemisphere happened close to the seasonal peak for respiratory illness. This may be why mortality levels have been generally worse after vaccinations. However, if the vaccinations are significant effective interventions, countries that have vaccinated more relative to others should have experienced a mortality trend that was better relative to others, but overall, they did not.
The failure of increased levels of vaccination to clearly improve mortality trends is surprising given the claims made that vaccines have "efficacy" levels of 95% and higher [1], especially when large numbers of vulnerable people were vaccinated early on in places like the UK.
Method
This study compares the number of deaths "with" covid-19 that have happened between the date vaccination started in each country and 17th March 2021 as a percentage of the number of deaths occurring in the same number of days preceding vaccination start. So for example, if this value is less than 100%, deaths have slowed down after vaccination; if the value is greater than 100%, then deaths have increased after the start of vaccination.
By comparing different countries, comparisons can be made to see if those that have vaccinated more have had a relatively better mortality trend as a result.
See notes on method below [2]
The Data
The data set includes the world's 50 largest economies minus countries in the southern hemisphere (as they will be experiencing opposite seasonal trends to the north). Also a handful of countries were excluded as they started vaccinating too recently for adequate data to be collected (assumed to be 30 days post vaccine start). Data was sourced from ourworldindata.org, more details below [3]. Also see below [4] for a key to the country abbreviations.
Results: G20 Countries
In the following chart, the focus is on just the G20 countries. This eliminates some potential outliers such as Ireland and Israel where there may may be anomalous patterns. A goal is to facilitate a comparison between broadly similar countries. Again we see that increased vaccinations correlate with a relative increase in deaths "with" covid-19.
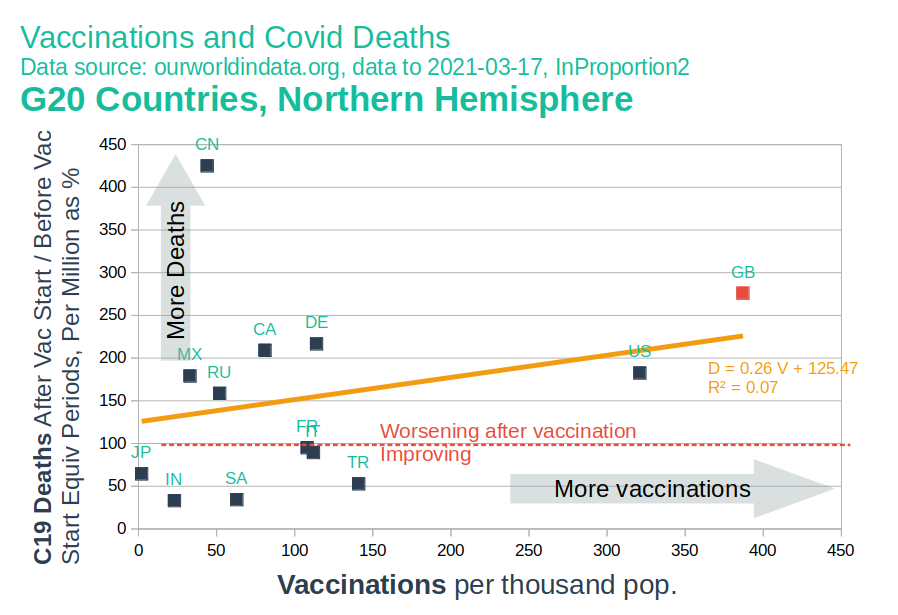
In this group the UK has vaccinated more than any other, but has had the second worst mortality change after China
Results: European Union + UK
Here the focus is on the European Union plus the UK. Again, increased vaccinations correlate with a relative increase in deaths "with" covid-19. The United Kingdom (GB) and Ireland (IR) are outliers, while the rest of Europe have had better outcomes.
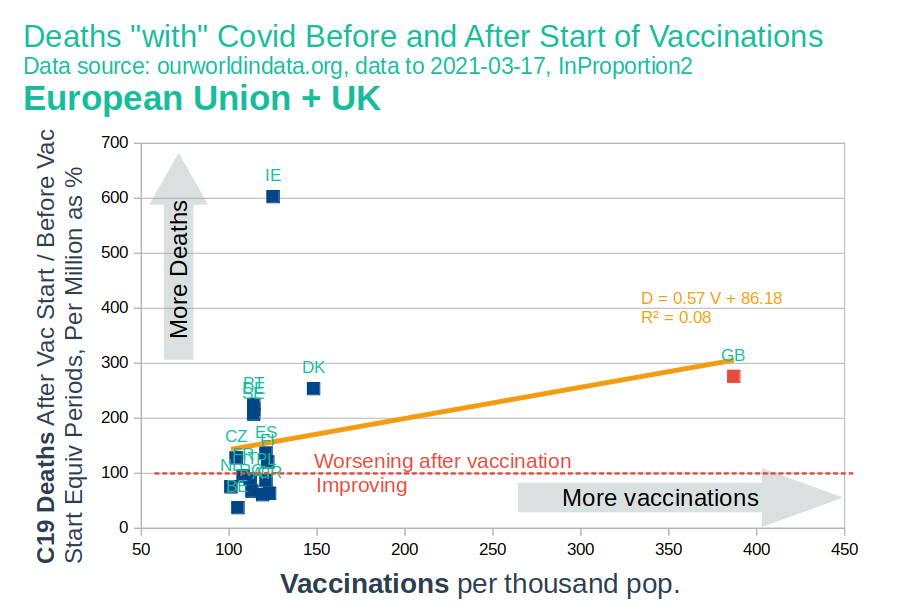
In this group the UK has vaccinated more than any other, but has had the second worst mortality change after Ireland
Results: Asia
Finally lets look at some of the countries excluded in the EU, UK and G20 views, namely those in Asia.
Interestingly the trend line now slopes very slightly downwards, but the slope is too shallow to suggest any significant effect. It should be noted that c-19 mortality levels have been much lower in Asia than they have been in Europe or the USA.
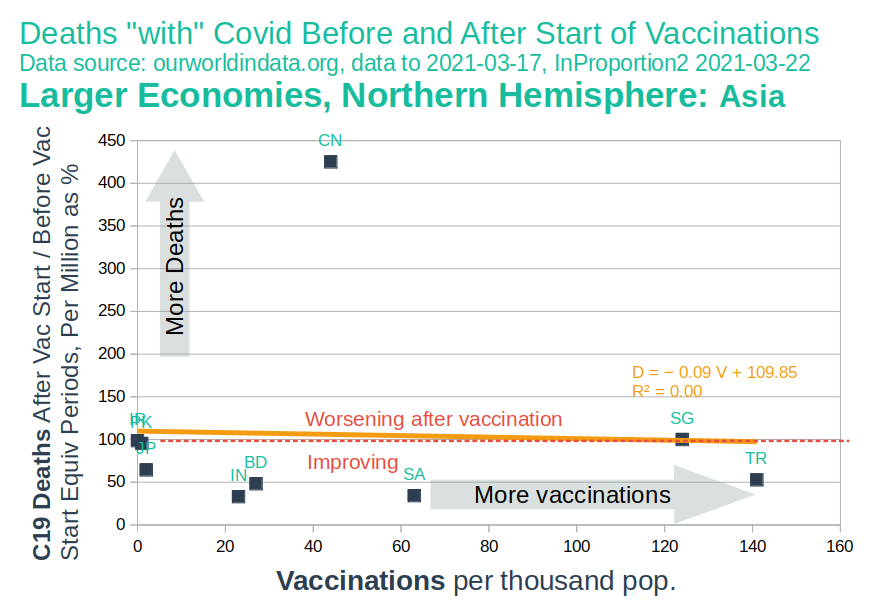
Mortality levels have been much lower in Asia compared to the USA and Europe. Vaccination does not seem to have affected the mortality trend significantly
Notes
[2] Method
-
Data was sourced from Oxford University Our World in Data (OWID) site. Dataset "owid-covid-data.csv" was downloaded on 2020-03-21
-
To understand the method, consider Austria:
-
2021-03-17 was selected as end date for data as the most recent date that could be used without there being too much missing data (same date used for all countries).
-
Y-axis: Consider Austria. According to the data they started vaccinating 2020-12-27 this is 80 days before the end-date of 2021-03-17. 80 days before 2020-12-27 is 2020-10-08. So consider period A as 2020-10-08 to 2020-12-27, and period B as 2020-12-27 to 2021-03-17. The deaths "with" covid in period B divided by the deaths in period A expressed as a % gives us the value for Austria on the Y-axis
-
X-axis: The value for the X axis for Austria is simply the number of vaccinations administered during period B expressed per thousand population, using the population number provided in the data set.
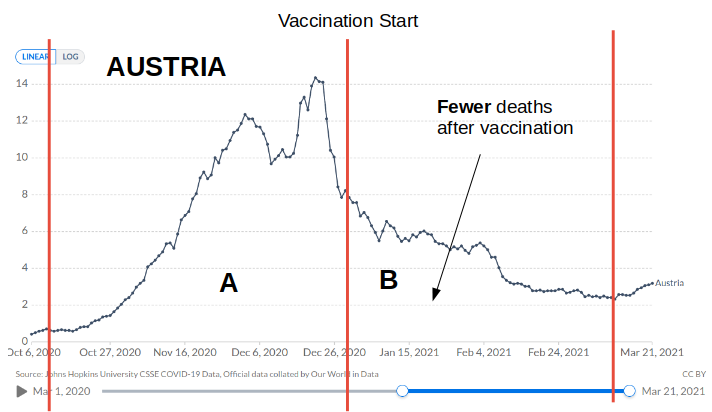
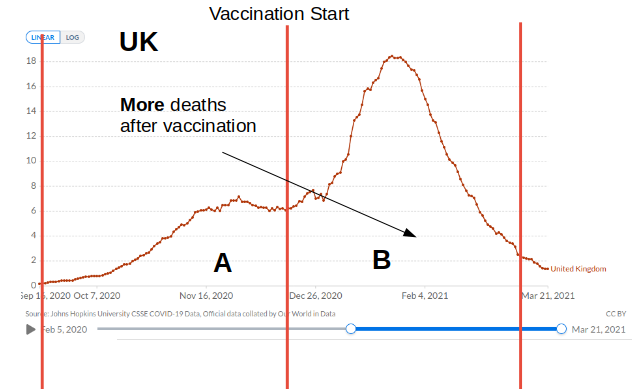
Illustration of method
- Column used: The OWID value for vaccination numbers used was "new_vaccinations_smoothed". This was used in preference to "new_vaccinations" as a number of values appear to be missing in this data series. E.g. for some dates there are values for the UK in the "new_vaccinations_smoothed" column that are close to Govt sources on vacccination numbers, while the corresponding "new_vaccinations" rows are empty. A similar phenomena was noticed for at least one other country. This is presumably a bug in the OWID data set.
-
-
[3] Countries included in the charts were selected as follows:
-
Start with the 50 largest economies
-
Remove those with capital cities in the Southern Hemisphere. Countries in the South will be experience a different seasonal trend from the North and were excluded
-
Remove countries with less than 30 days of vaccination data prior to the data cut-off of 2021-03-17
-
The remaining data set was then plotted as a whole and in sub-groups such as EU plus UK.
-
[4] Country list in descending order with the worst covid-19 mortalility trend first.
Ireland (IE), China (CN), United Arab Emirates (AE), United Kingdom (GB), Denmark (DK), Portugal (PT), Germany (DE), Canada (CA), Sweden (SE), United States (US), Mexico (MX), Israel (IL), Russia (RU), Norway (NO), Spain (ES), Czechia (CZ), Finland (FI), Singapore (SG), Iran (IR), Egypt (EG), Pakistan (PK), France (FR), Italy (IT), Poland (PL), Netherlands (NL), Romania (RO), Japan (JP), Greece (GR), Austria (AT), Turkey (TR), Bangladesh (BD), Colombia (CO), Belgium (BE), Saudi Arabia (SA), India (IN), Switzerland (CH)
Data
| Country | Abbreviation | Vaccinations per thousand population | Deaths after vax start as % of equivalent period preceding vax start |
| Austria | AT | 119 | 61 |
| Bangladesh | BD | 27 | 48 |
| Belgium | BE | 105 | 38 |
| Canada | CA | 81 | 209 |
| China | CN | 44 | 425 |
| Colombia | CO | 17 | 42 |
| Czechia | CZ | 104 | 128 |
| Denmark | DK | 148 | 254 |
| Egypt | EG | 0 | 97 |
| Finland | FI | 122 | 120 |
| France | FR | 108 | 95 |
| Germany | DE | 114 | 217 |
| Greece | GR | 123 | 63 |
| India | IN | 23 | 33 |
| Iran | IR | 0 | 99 |
| Ireland | IE | 125 | 603 |
| Israel | IL | 1084 | 174 |
| Italy | IT | 112 | 89 |
| Japan | JP | 2 | 64 |
| Mexico | MX | 33 | 179 |
| Netherlands | NL | 101 | 75 |
| Norway | NO | 131 | 155 |
| Pakistan | PK | 1 | 95 |
| Poland | PL | 121 | 86 |
| Portugal | PT | 114 | 225 |
| Romania | RO | 113 | 67 |
| Russia | RU | 52 | 159 |
| Saudi Arabia | SA | 63 | 34 |
| Singapore | SG | 124 | 100 |
| Spain | ES | 121 | 136 |
| Sweden | SE | 114 | 207 |
| Switzerland | CH | 108 | 28 |
| Turkey | TR | 141 | 53 |
| United Arab Emirates | AE | 590 | 357 |
| United Kingdom | GB | 387 | 276 |
| United States | US | 321 | 183 |