When the UK Government presents trends in Covid infections it fails to put them in the context of dramatically increased numbers of tests.
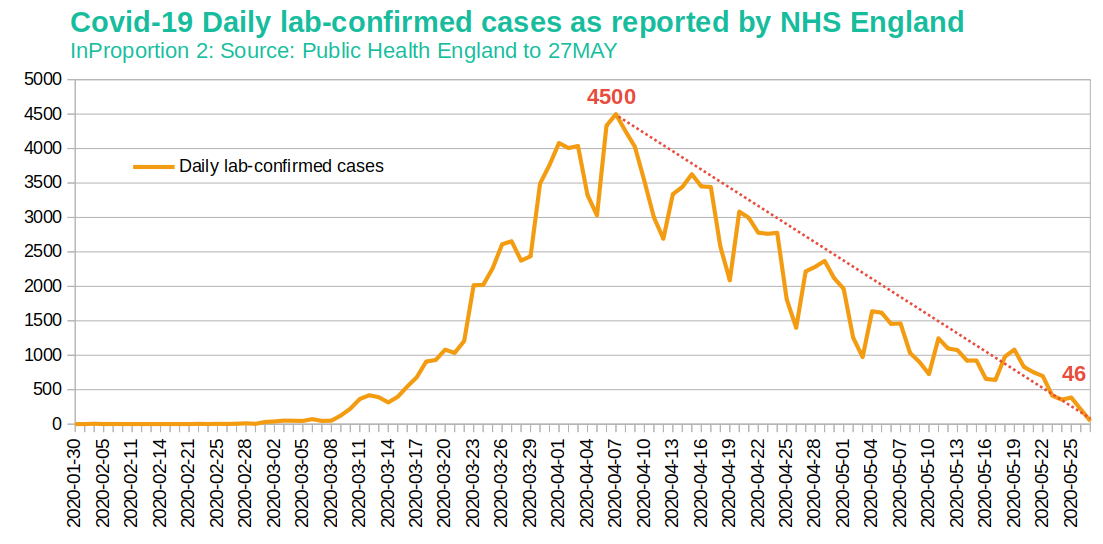
On 27 May 2020, three NHS Regions reported zero new infections:
- South West
- South East
- East of England
London had just one new infection.
Here is the trend in a graph. There are now around 1000th of the number of new cases detected per day (4500 positive tests on 7 April vs 46 on 27 May):

Good news for everyone: new Covid infections seem to be disappearing from the radar! [3]
The official government view is less positive
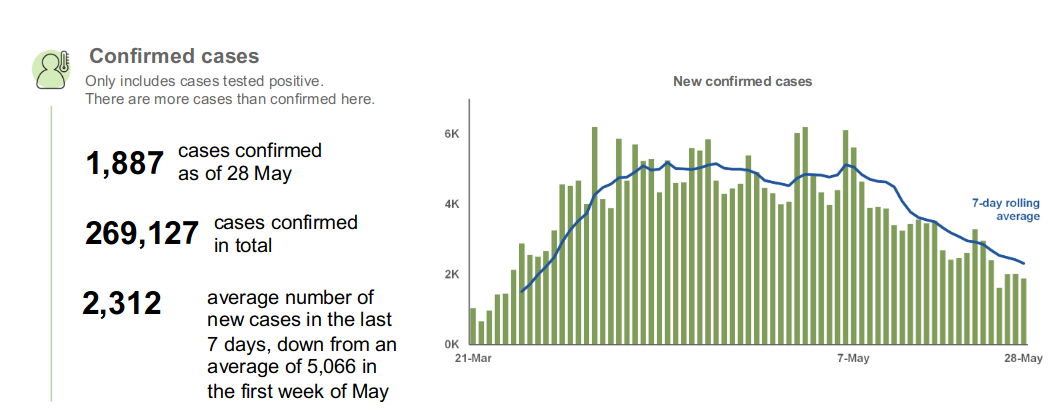
This is the view of new infections presented by Downing Street on 28 May:

While they show a decline, it is not as dramatic as the NHS England data as published by Public health England [1][3].
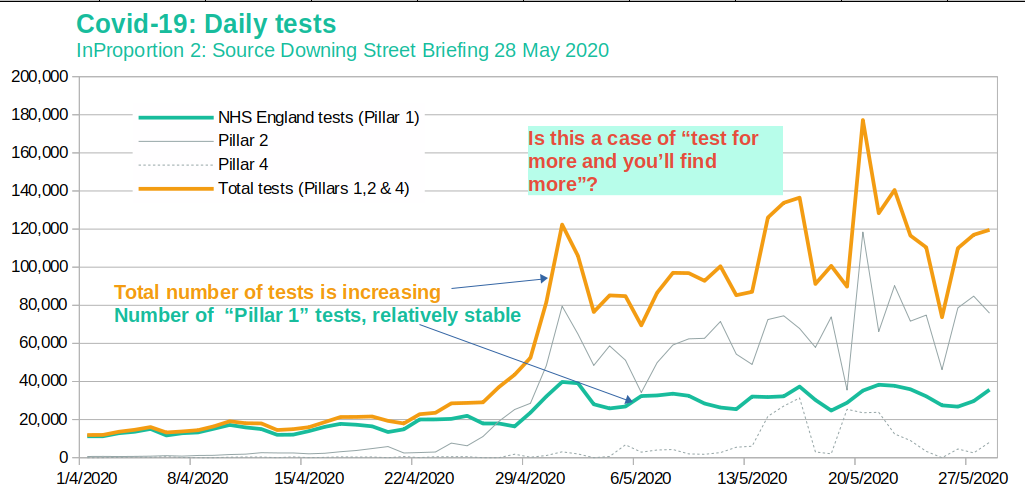
Could part of the explanation be that as they ramp up the number of tests, unsurprisingly they find more cases?
The following chart shows the number of tests being done. The NHS England case numbers are based on so-called "Pillar 1" tests that are conducted in labs and hospitals. The Downing Street case numbers are based on total tests which add tests from other sources including swab tests done by third parties (Pillars 1,2 and 4). See below [2] for definitions of the different pillars.

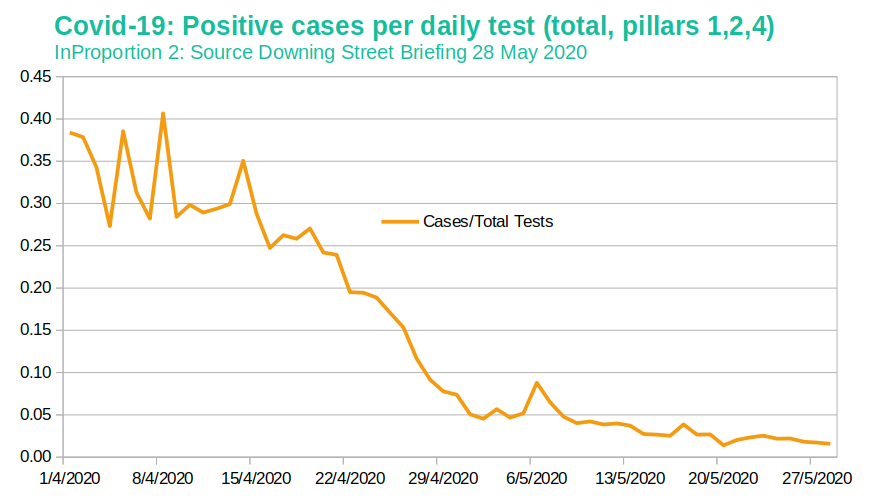
If we divide the number of positive cases by the number of tests, we get another trend altogether - it is another picture of new Covid infections disappearing off the radar.

Given that around half [4] those people with infections are likely to be asymptomatic, and only a small proportion of the population will ever be tested, the actual numbers of people with an infection is an unknown. The actual number of infections is far less interesting than the trend in test results as a proportion of the number of tests conducted.
To get the best indication of the trend, Pillar 1 tests are probably the most reliable tests and have been conducted in relatively steady numbers.
Based on this, the positive Covid tests are disappearing off the radar.
The Government is being misleading when it presents trends in new Covid Infections
Sources / Notes:
-
[1] Slides and datasets to accompany Downing St. coronavirus press conference: 28 May 2020
-
[2] Definition of Pillars (from [1])
-
Pillar 1: swab testing in PHE labs and NHS hospitals for those with a clinical need, and health and care workers.
-
Pillar 2: swab testing for the wider population aged 5 and over, as set out in government guidance.
-
Pillar 4: serology and swab testing for national surveillance supported by PHE, ONS, Biobank, universities and other partners to learn more about the prevalence and spread of the virus and for other testing research purposes, for example on the accuracy and ease of use of home testing
-
-
[3] CSV data downloaded from coronavirus.data.gov.uk
-
[4]