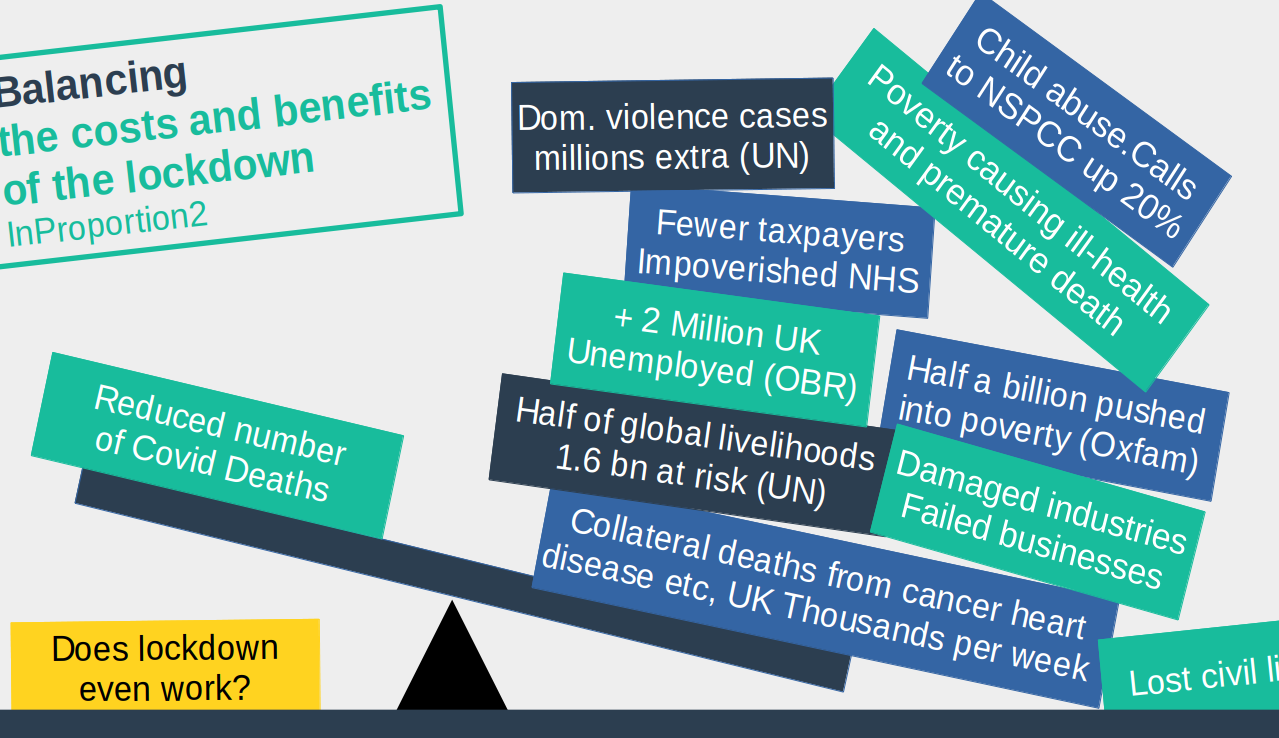
The lockdown is damaging the economy, which in turn will cause poverty, health issues and premature death for countless people. We must not sleep walk into this, distracted by petty news stories of advisors who have fallen from grace.
17th Century Tulip Mania - forget the gossip, we want to understand the fundamentals
In the infamous tulip mania of the 17th century, a craze for exotic varieties drove the price of single bulbs to a peak of around £200 in today's money. In February 1637, people woke up and the price suddenly crashed, leaving investors out of pocket and future historians puzzling on the causes.
We can guess that like Dominic Cummings and Neil Ferguson today, there were some "experts" then who were blamed, but when we look back at the mania, we are not interested in the gossip but in the fundamentals: Why were more people not doing simple sums, such as calculating how much it costs to grow a field of tulips?
How did people get out of step with reality in connection with tulips? Has the same thing happened with Covid-19 - so called "Coronamania"?
Exponential growth is very scary
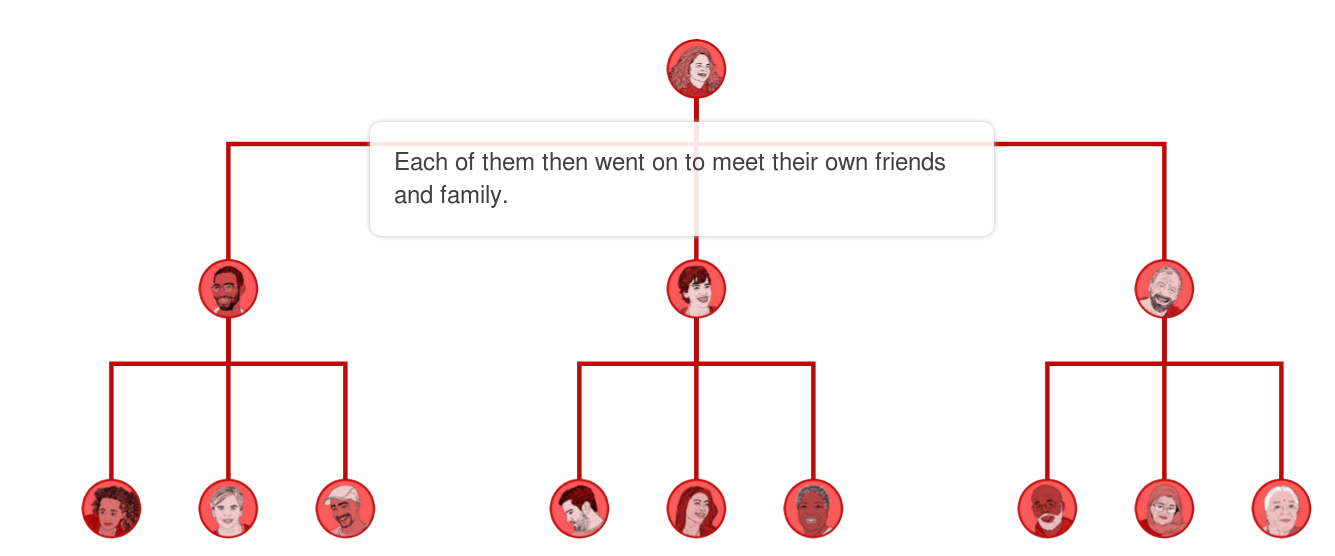
A key justification for lockdown was the need to prevent exponential growth of infections. Perhaps you saw the same BBC animation I did that explained how exponential growth occurs:
-
Without lockdown one person infects 3, who in turn infect 9 then 27, 81, 243
-
With lockdown if each person only infects 2 we slow these five steps of infection to 2,4,8,16 32
So with lockdown we might prevent 211 or 87% of infections (243 - 32). It may look like lockdown should work but remember, so far this is just a theory.
BBC illustration of how Covid will spread exponentially [2]:
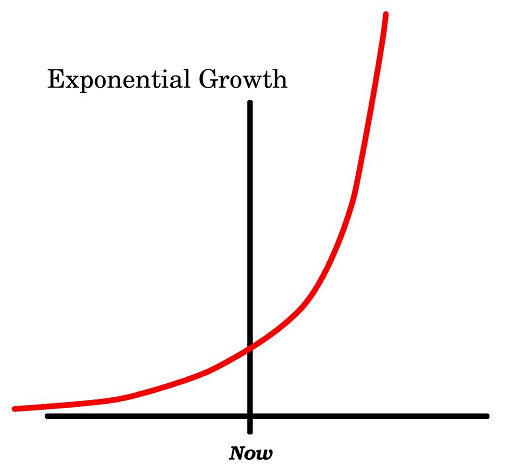
We should all fear exponentials. If you do not pay the interest on a loan, your debt will rise exponentially and before too long you will be bust. You will already know the shape of an exponential curve. Here is a reminder:
Fearing exponential growth of infections is a key reason why the UK Government felt justified in ordering extreme measures that would damage the economy and public health.
On 26th March 2020, Imperial College, key advisers to the UK Government, gave this advice:
"We estimate that in the absence of interventions, COVID-19 would have resulted in 7.0 billion infections and 40 million deaths globally this year. Mitigation strategies ... could reduce this burden by half, saving 20 million lives but we predict that even in this scenario, health systems in all countries will be quickly overwhelmed" [3]
Imperial's *best case* scenario, with mitigations, was 20 million dead globally and health systems in all countries overwhelmed.
But this estimate was hopelessly wrong. Two months later at the tail end of the pandemic - despite a number of countries not having implemented maximum mitigations - global death toll is around 350,000 and health care systems in the UK have not been even close to overwhelmed:
On 13th April 2020, two or three days after peak infection had been reached, it was reported that:
"40.9 per cent of NHS general acute beds were unoccupied...nearly four times the normal amount of free acute beds at this time of year." [4].
What is exponential growth?
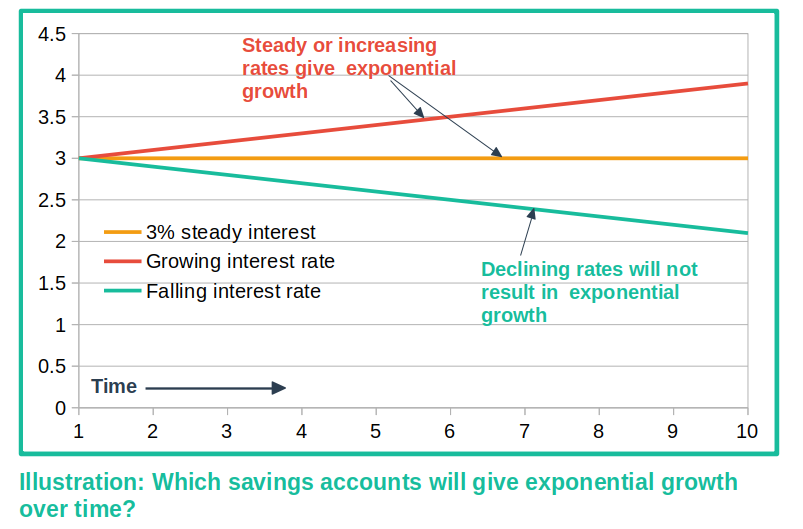
Exponential growth is growth that increases by a constant proportion. Suppose you have a savings account, and it pays 3%. Your money will grow exponentially. If you are lucky enough to have a special account where the interest rate increases over time, then you will also have exponential growth.
If your interest rate declines over time you do not have exponential growth. You will have growth, but not the exponential kind that can be so dramatic. Here is this point made in a graph.
Have Covid infections grown exponentially?
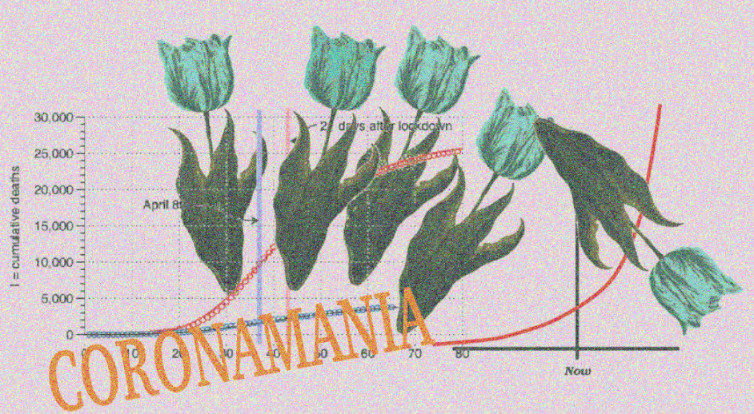
The following chart produced by financial strategist Alistair Haimes should put the above question to rest (compare it with the above chart).
The left hand side starts in March 2020 when the UK had had its first 300 infections and then stops at 10 April when Europe as a whole had reached a growth rate of zero or less. The chart is analogous to the above chart of interest rates. If you cannot distinguish the different colours and European countries don't worry too much (UK is dark blue) as they all show the same overall pattern. The trends are all downwards, from start to finish.

-
There was no exponential growth in Covid-19 infections the UK. From the first days of the outbreak growth rates were in decline.
-
When the UK ordered a strict lockdown, it should already have been clear to the Government's advisors that infection rates were in decline and this should have been reason to greatly reduce the perceived threat from Covid.
-
It should have been clear to all that the estimates published by Imperial College were completely wrong.
There is no indication that the UK lockdown had any impact on the decline in the growth rate. The rate was in a similar decline before and after the lockdown
Covid cases in the UK have never grown exponentially
To emphasise the point, the difference between exponential growth and non exponential growth looks like this:
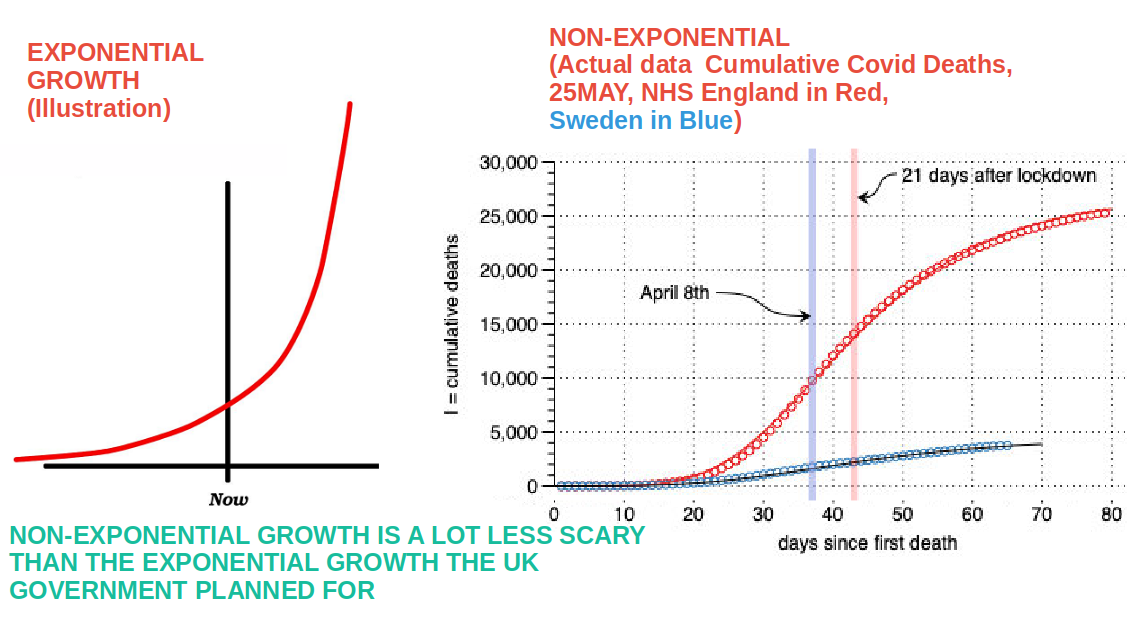
In the above right hand chart plotted by Professor Paul F Dennis, the spiky data has been smoothed to show the trend. Two key dates are highlighted:
-
April 8th is the day when daily deaths peaked in England.
-
21 days after lockdown is the typical time from infection to death.
Professor Dennis's chart suggests that Covid-19 deaths in England peaked before the lockdown could have had an impact.
At the start of lockdown, the outbreak was already in sustained decline
When the UK went into lockdown, the available data showed that Covid was already in a sustained decline. It should have been a clear indication that the spread of the virus would be limited. Perhaps it was a state of panic that prevented the UK government from seeing this.
Similar data, but more advanced in time, was already available from Hubei and the rest of China. The rise and fall of the virus followed the same pattern we later saw in the UK, Netherlands and Sweden (and most other countries with an outbreak). All this data was available to the UK government long before it decided on a lockdown.
Nobel Prize winner and Stanford Professor of Structural Biology Michael Levitt had already identified back in January that Covid-19 did not follow exponential growth patterns.
The following interview is highly recommended as he explains the general principals of much of the above, but adds the context of China. The true nature of Covid-19 should have been understood very early in the year and it is hard to see how economy and public health destroying measures taken by many countries could possibly be justified.
Would the spread of the virus have been worse without lockdown?
Too many take it for granted that the lockdown must have saved lives by slowing the spread of the virus. Presumably they think that because a BBC animation or similar shows it, it must be true.
Sweden forbade gatherings of more than 50 people. Otherwise, businesses and junior schools were able to stay open and the economy was broadly able to carry on as usual. Compared to the UK and Sweden, the Netherlands followed a middle path.
With data provided by Google, we can track the degree to which people followed the policies set by their governments.
Google continually track where users of the Android platform are and provide this data in an anonymised form [6]. Twitter user @boriquagato has charted this for the UK, Netherlands and Sweden. On the left of the chart you can see life before the lockdown. Around the 23 March, you can see a dramatic drop in mobility for the UK, and less marked changes for Netherlands and Sweden.
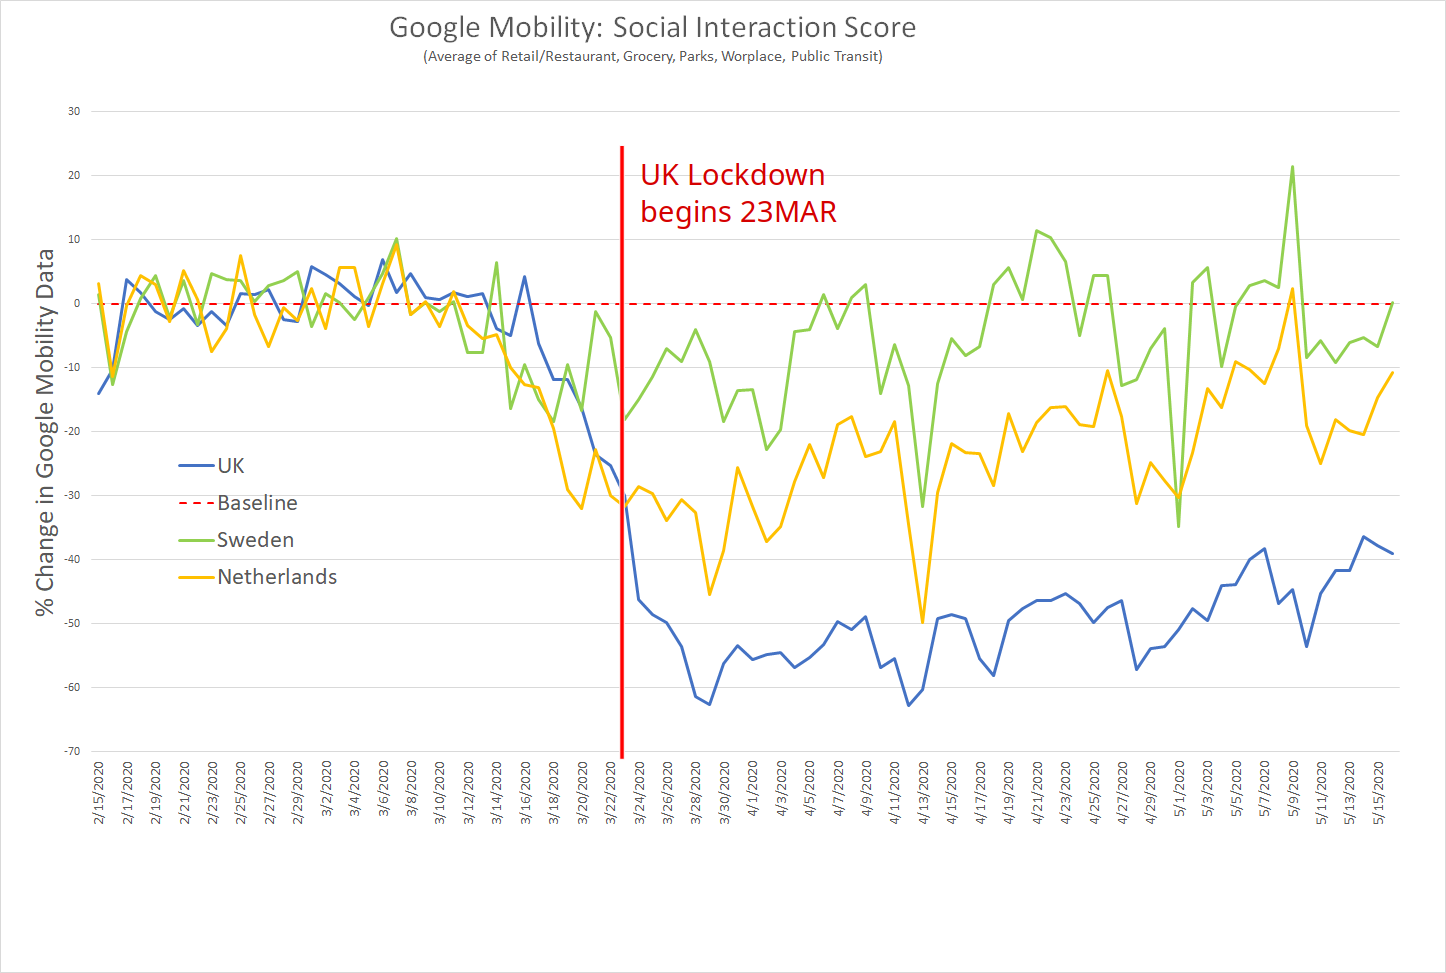
People in the UK, as required by their government's policy, were significantly less mobile than the Dutch, who in turn were less mobile than the Swedes.
This is unsurprising. Each country was following the policy that was set by its government.
So how did this change in mobility, or severity of lockdown, effect the spread of the virus?
The following chart shows how many people died compared to the previous day for the three countries [7]. If the value is one, it means the same people died on that day as per the previous day. As we can see, and should already know, UK deaths peaked around 19-21 April and the numbers dying each day went into decline.
The very important observation from this chart is that the lines are almost identical for all three countries. If lockdown had an impact, you should be able to see it in the rate at which people get infected - but you cannot.
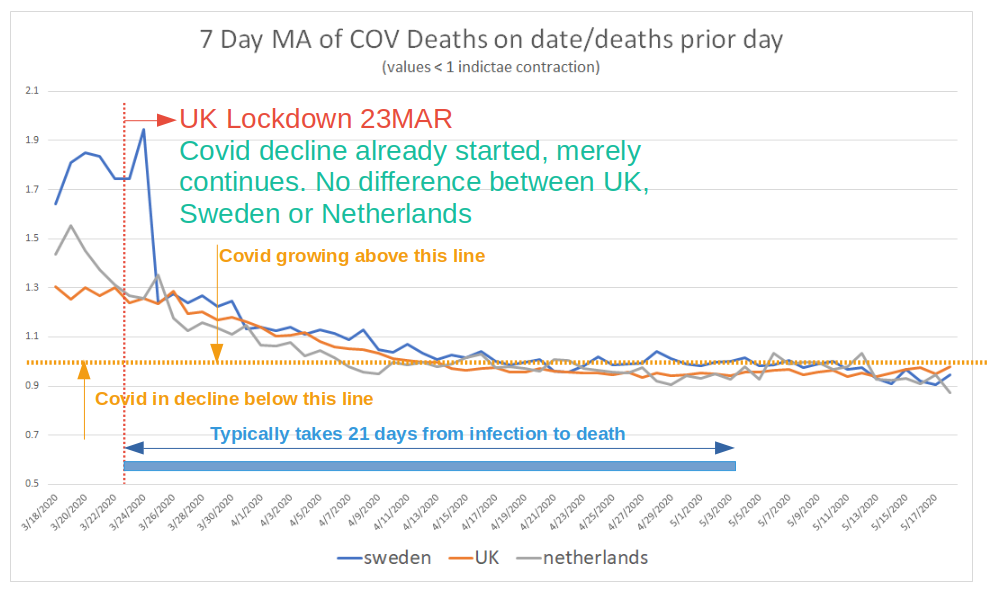
The very important conclusion is that the rate at which the virus attacks and decays appears independent of the level of lockdown (MA = Moving Average)
Other researchers have examined this question in different ways and have come to similar conclusions, e.g. William Briggs, former Professor of Statistics at Cornell University has compared Covid deaths per million of population in countries with and without lockdown as indicated in data published by www.worldometers.info. (Key countries identified by worldometers.info as "not locked down" included Taiwan, Hong Kong, Japan, South Korea, Egypt and Belarus) [8]
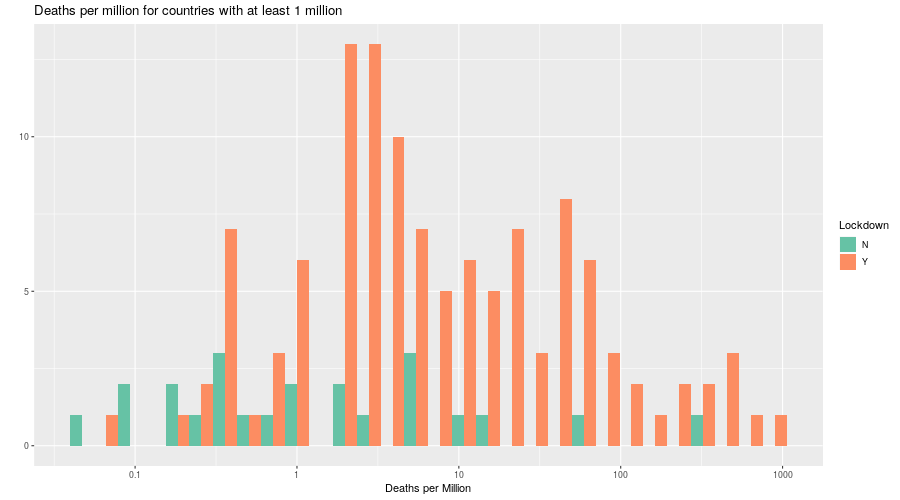
Would you rather be in one of the red countries (lockdown) or green (no lockdown)?
Most of the world has had some Covid-19 - if it is so virulent as some feared, why did it not run wild in the countries without lockdown?
As these researchers would readily admit, these studies are not proof. Data may be suspect for different reasons and approximations have to be made. However their findings that lockdown appears to be ineffective are consistent with numerous studies that find viruses spread best indoors [9], something that lockdown encourages rather than prevents.
Importantly the burden of proof for lockdown does not lie with sceptical researchers, it lies with those who recommend that we change our way of life, sacrifice our economy and take the deadly measures such as those we have taken in the UK in return for an uncertain benefit.
So far I have not seen any such justification in the form of research or data. In the UK the decision to lockdown seems to have been based mostly on the forecasts of Imperial College that were not only patently absurd, but by many accounts were based on flawed, bug ridden and geriatric computer code [10] [11].
How deadly is Covid-19?
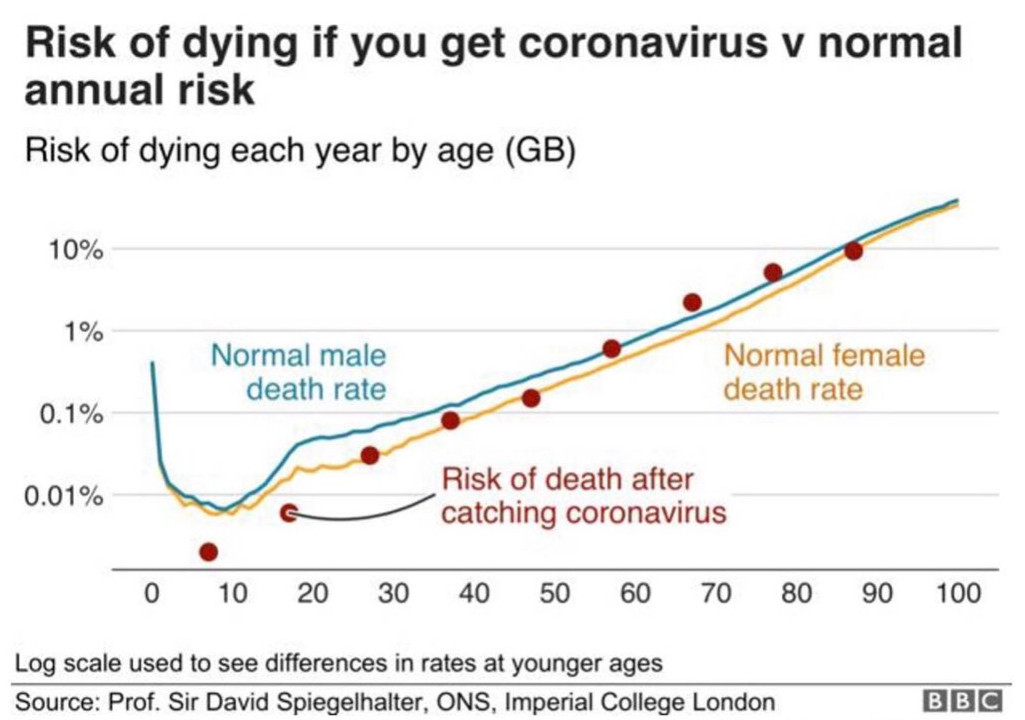
It appears that the spread of the virus has been greatly overestimated. The other key issue is how deadly is the virus if you catch it. Statistician Sir David Spiegelhalter has plotted this in a very important chart, below - note this is actual data, not estimates or forecasts.
The Y-axis shows how likely it is a person will die within the year against the person's age on the X-axis. As you can see, babies are not as secure as 8 to 9 year olds who, thankfully, have a very small chance of dying within the year. On the right hand of the chart, the risk of death goes up very sharply (more sharply than it looks as the data is plotted on a log scale).
The blue line represents males, the orange represents females and the red dots are people with Covid.
Waking up from Coronamania?
Some countries seem now to be moving away from a view that lockdown was a good or necessary policy:
9 May, Germany
External experts on the Corona paper from the Federal Ministry of the Interior:
"..therapeutic and preventive measures must never be more harmful than the disease itself. The aim must be to protect the risk groups without endangering medical care and the health of the general population, as is unfortunately the case right now." [18]

16 May, South Africa
Dr Glenda Gray, chairperson of the South African Medical Research Council stated that the lockdown should be eradicated completely. The government needed to reflect on its decisions and admit it had made mistakes. She said:
"You also have to be nimble enough … you have to either balance saving your face, or saving your country, and which is more important?" [17]

22 May, Denmark
A row was reported in with the the government in conflict with its own health agency which did not back the government's decision to lockdown
Kjeld Møller Pedersen, professor of health policy at the University of Southern Denmark said:".
The Prime Minister "abused health-care advice" and had "given the impression that it was the advice of the health care authorities to lock down. But that seems to have been untruthful."[14]
22 May, Norway
Camilla Stoltenberg, Director General of the Norwegian Institute of Public Health stated:
"Our assessment now....is that we could possibly have achieved the same effects and avoided some of the unfortunate impacts by not locking down, but by instead keeping open but with infection control measures...The scientific backing was not good enough" [15]
25 May, Belgium
The Belgian Interior Minister Pieter De Crem stated:
If there was a second wave..I think we can rule out that we will have to go back to the tough [lockdown] measures” [16]

Coronamania: conclusions
-
The rate at which Covid-19 would spread was grossly overestimated in the early stages of the outbreak. This should not have happened in the first place (given China's data) and absolutely should then have been corrected in April as more data became available.
-
The risk of dying as a result of catching Covid-19 has been grossly overestimated.
-
So far there is no evidence to demonstrate that lockdown reduced the spread of the virus. On the other hand, it appears that the way the virus has risen and fallen in numerous countries is much the same, regardless of the lockdown measures taken or not taken. The UK government's insistence that lockdown saves lives is not based on evidence.
-
For the UK government to order such a destructive lockdown without adequate justification is a blunder of historic proportions that has been compounded by an apparent inability to correct course en route as new information becomes available.
Sources:
-
[4] NHS hospitals have four times more empty beds than normal, HSJ (healthcare journal), 13 April 2020
-
[5] Data plot by Journalist Alistair Haimes on Twitter, 11 April, 2020
-
[10] Code Review of Ferguson’s Model, lockdownsceptics.org, 6 May 2020
-
[12] Has the government overreacted to the Coronavirus Crisis? Toby Young in The Critic, 31 March 2020
-
[13] Lockdowns don’t work, American Enterprise Institute, Lyman Stone, 21 April 2020
-
[14] Danish PM 'falsely claimed health agencies backed lockdown', The Local Denmark, 22 May 2020
-
[15] Norway 'could have controlled infection without lockdown': health chief, The Local Norway, 22 May
-
[16] Belgium will not return to tough lockdown: minister, Reuters, 25 May 2020
-
[18]